Data visualisation has become a game-changer in motorsports by providing teams and drivers with valuable insights and strategic advantages. The data is gathered from the vehicle to assist drivers and engineers in comprehending how the machine functions in a dynamic setting. Familiarising with the vehicle’s performance during a race is crucial for further refinement of the overall performance of the racing team. In this article, we pore over the data visualisation applications in motorsports and how it has revolutionised how teams, drivers, engineers, and fans engage with the sport.
Data Visualisation Essentials
The first step to harness data visualisation is to focus on the key elements and metrics defined. In this case, checking indicators such as vehicle speed, RPM, throttle position, lap times, lateral and longitudinal G-forces, and engine health are critical data points to monitor. These traits give paramount insights into driver performance, tire wear, and overall car health. Engineers start by employing a simple set of sensors and progressively expand the system as the analysis abilities improve.
Telemetry Systems
In recent years, data analysis or telemetry systems have become more accessible, even for grassroots motorsports enthusiasts. The insights are a detailed analysis of driver performance and car dynamics, which can be relevant to refine driving strategies, improve lap times, and ultimately achieve better race outcomes. Through the data overlay from different laps or comparing drivers, patterns and areas for improvement become evident. For instance, comparing speed and throttle position can reveal where a driver may lose valuable time or prevent engines from failing.
Performance Dashboards
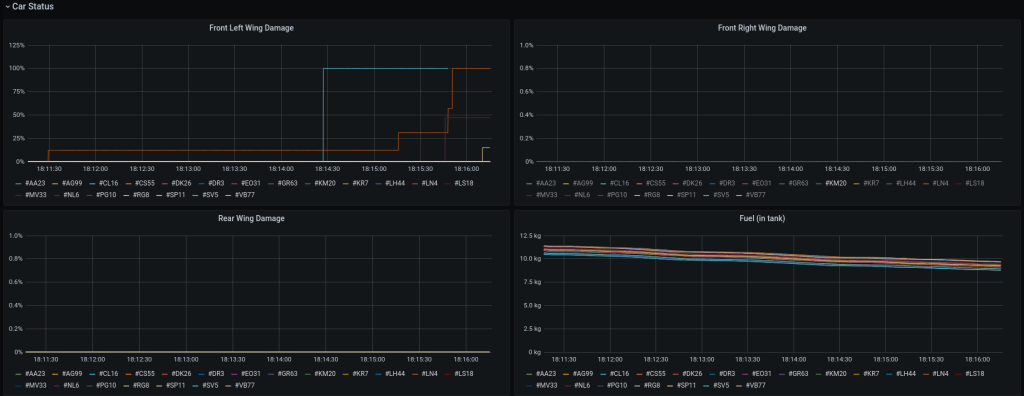
Performance dashboards are tools that endorse teams and drivers to monitor and track key performance metrics in real-time. These dashboards serve as a user-friendly data display, facilitating quick decisions based on live data feeds. After examining lap times, fuel consumption, and tire wear, teams flag trends, spot anomalies, and adjust strategies on the fly. The dashboards streamline decision-making processes and provide a comprehensive overview of the car’s performance.
Driver Performance Improvement
In motorsports, every second and every lap counts. The ability to make split-second decisions based on real-time data is paramount to success on the track. Engineers rely on data visualisation to analyse millions of data points collected from the cars and transmit them to their dashboards. This instant access to data empowers engineers to sustain drivers with precise instructions and feedback to elevate their performance. As a result, teams can identify areas for improvement and assist drivers in making decisions during races.
Competition Analysis
Being in such a competitive industry means that the priority is to maintain a lead at all costs. Data visualisation allows engineers to closely track their rivals’ performance in real-time and decide strategically. Teams proceed to formulate effective racing strategies by inspecting tire conditions, pit stop intervals, and vehicle distances. This immediate analysis helps teams perform actions regarding pit stop timings or when to attempt overtaking manoeuvres.
Race Scenarios Simulation
Simulating race scenarios is indispensable for predicting outcomes and testing differing strategies. The data gathered can be handy to understand the potential impact of weather conditions, tire choices, and fuel consumption. Simulations assent to teams to calibrate their strategies, optimise performance, and outsmart competition. Besides, integrating data visualisation with simulation technologies has broken new ground for race and testing preparations.
Monitoring and Attaining Talent
With data visualisation, it is possible to identify and nurture talented drivers and set the foundation for a team’s future vision. Being a large pool of talent, Formula 1 is one of the leaders in talent acquisition since every side has its sights set on following the performance of young drivers.
With data loggers connected to the drivers’ vehicles, teams can analyse various performance metrics and decide about promoting drivers to higher competition levels. This data-driven approach heeds the identification of promising talents and selects drivers with the best stats, indicating their prowess and capabilities to thrive at the pinnacle of motorsports.
Interest Beyond The Track
Motorsports captivate, along with the fans, media workers, analysts, and specialists who deliver insights and analysis of the sport. In this environment, where data is abundant, visualisation is a powerful tool for communicating complex information in a digestible way. While not all spectators may be data experts, they appreciate compelling details about the car’s performance, lap times, and race statistics. Furthermore, data visualisation aids media professionals and analysts in perceiving public domain data, spotting trends, and providing professional opinions on team performance. Through this, even non-specialists can understand and appreciate the intricacies of the sport.
Continuous Collaboration and Learning
The motorsports industry is a lively and enthusiastic gathering of people striving to exceed limits. Within this community, individuals passionate about data visualisation have discovered a place to collaborate, share their work, and acquire knowledge from others. Online communities and forums exclusively devoted to visualising data in motorsports offer enthusiasts a platform to display their talents, receive input, and gain valuable wisdom from industry experts.
Final Thoughts
Data visualisation has become an indispensable tool in motorsports, playing an essential role across all aspects of the sport. Teams and analysts can make trusted decisions, boost performance, and gain a competitive edge by presenting effectively complex data sets in a visually appealing and easy-to-understand format. Likewise, the ability to quickly and accurately interpret data visuals allows for real-time adjustments during races, which leads to an improved overall race strategy.
Moreover, data visualisation also enhances the fan experience as it provides a deeper understanding of the sport and enables spectators to analyse and appreciate the particularities of motorsports. The coming years appear incredibly promising as it holds the potential for exciting developments and innovations in data visualisation that will unfold soon.